


The Everything Bubble
We might be in the biggest financial bubble in history.

We might be in the biggest financial bubble in history.
I usually write about undervalued and undercovered stocks, but today’s topic is too important to ignore.
Let's start by talking to our good friend, Fred.
If you’re not familiar, FRED is the official database of the Federal Reserve, where they publish all kinds of economic data.
And Fred can tell you a lot of things.
For example, that while U.S. GDP—the total value of all real goods and services produced—is growing slowly, U.S. debt is skyrocketing:

Not exactly breaking news.
Anyone who follows the market has seen the endless memes of Jerome Powell and his money printer.

No matter how you slice it, money is just getting printed:

The total money supply is measured in different ways.
They are called M1, M2, M3.
M1 (cash and demand deposits) is a particularly interesting chart:

M2 includes more theoretical money that's not as liquid as M1 (savings accounts, time deposits, and money market funds):

That’s why the 2020 spike in M2 looks slightly less extreme—it factors in more variables.
But no matter which metric you use, one thing is clear: the money supply is skyrocketing.
But you know what else is skyrocketing?
Derivatives exposure.
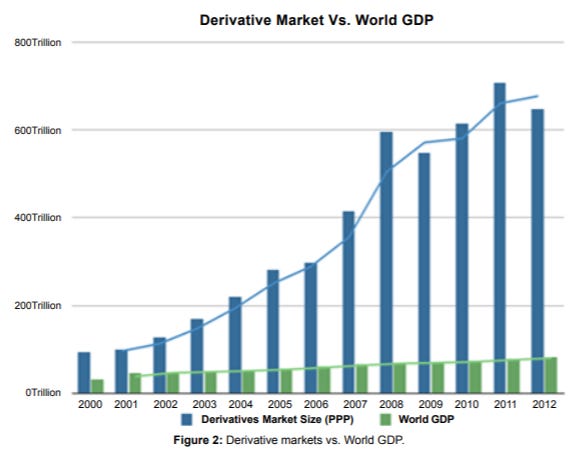
GDP is shown in green on this chart. As you can see, it’s barely moving, while derivatives are exploding.
A derivative is a financial contract whose value is derived from an underlying asset—like a stock, bond, commodity, or even an index.
Think of it like this: Instead of buying a stock directly, you make a side bet on how the stock will perform in the future.
For example:
You don’t buy JPMorgan stock outright. Instead, you take a derivative position, saying, "I bet JPMorgan stock will go up by 5% in the next month."
If you're right, you profit—if you're wrong, you lose money.
Sounds simple, right?
But here's where it gets wild:
Because derivatives often involve leverage, a small movement in the underlying asset can result in huge gains or losses.
Example:
JPMorgan stock rises by just $1. But because of leverage, some derivative contracts could move by hundreds or even thousands of dollars.
In large financial markets, this means millions or even billions of dollars can shift instantly.
It's an extremely complex topic.
Just so it’s clear what we’re dealing with here—the top three financial institutions in the United States each hold over $50 trillion in derivative bets.
The big issue?
Extreme concentration of risk.
These three banks—JPMorgan Chase, Citibank, and Goldman Sachs—hold $157.3 trillion in derivatives. That’s 77% of all derivatives held by the 4,614 federally insured financial institutions in the U.S. (See chart below.)

This table is in millions of dollars.
And if you check the assets column, the numbers get even crazier:
Goldman Sachs is sitting on $51 trillion in derivatives while holding just half a trillion dollars in actual assets. That’s 100:1 leverage.
Citibank, which imploded in 2008 due to reckless derivatives and off-balance-sheet vehicles—requiring the largest bailout in global banking history—is holding even more derivatives today than it did before the 2008 crash.
This is where the concept of "Too Big to Fail" (TBTF) comes into play.
Financial institutions this massive and interconnected cannot be allowed to fail without catastrophic consequences for the entire economy.
Their collapse would trigger a domino effect—freezing credit markets, wiping out savings, and potentially collapsing the financial system itself.
And the banks know this.
The implicit government safety net encourages them to take on even greater risks, knowing they’ll be bailed out if things go wrong.
This creates a dangerous cycle of increasing risk exposure, moral hazard, and financial instability.
A lot of economists have termed this „The Everything Bubble“.
And for good reason.
As all this money got pumped into the system, it skyrocketed the value of stocks—all stocks—cryptocurrencies, and other assets.
You name it.

→ S&P 500 Index
But we've also seen huge spikes in mortgage-backed securities.

This has been happening since 2010.
These are the same financial instruments that caused the 2008 housing collapse.
And they’re on the rise again.
So are student loan asset-backed securities.

A security is a financial asset that can be bought, sold, or traded—like stocks, bonds, or asset-backed securities (ABS).
Think of it like a slice of pie:
A company slices itself into shares and sells them as stocks.
Banks do the same with loans—they bundle them together (like student loans or mortgages), slice them up, and sell pieces as securities.
Student loan asset-backed securities mean banks pool thousands of student loans and sell pieces of that debt to investors. Investors then profit as borrowers repay.
The risk?
If too many borrowers default, these securities collapse in value—just like mortgage-backed securities in 2008.
That way, you can make money off of collective student loan debt.
Well, the banks make money off of it.
I think this chart below shows the phenomenon a little bit more clearly because it's a new thing.

That‘s what you call financial innovation.
But this has also been done to car loans, which are at record highs right now:

Oh, and consumer credit card debt?
Yeah, that’s also at an all-time high:

All of this just illustrates how overleveraged the entire economy is right now.
Everything is overextended at the same time.
Over the last decade, the stock market has been on an insane pump.
But a huge amount of that “value” isn’t real.
It’s propped up by derivatives, leverage, and speculation. The financial world thrives on side bets, creating the illusion of higher valuations.
Take Apple, for example:
If enough people start betting that Apple’s stock will rise, that hype alone pushes the stock up. That price movement fuels even more bets, which create even more buying pressure—and the cycle repeats.
The result?
A house of cards built on speculation, not fundamentals.
Officially, global derivative exposure is around $600 trillion. But due to over-the-counter (OTC) derivatives, the real number is unknown.
Some estimates put the total exposure in the quadrillions!
A number so absurd it barely makes sense.
We don’t know the actual figure because OTC derivatives are unregulated and have extremely lenient reporting standards.
This means financial institutions are essentially playing in the shadows, making high-risk bets with little transparency.
How We Got Here: The Fed’s Role in the Bubble
The origin of this financial bubble dates back to November 3, 2010.
The U.S. economy was struggling—GDP was crawling at 1.2%, and unemployment was at 9.6%.
Faced with a weak recovery, the Federal Reserve took a radical step: they decided to flood the system with easy money.
That move changed everything.
The Fed launched Quantitative Easing (QE)—a fancy financial term for printing money out of thin air and using it to buy government bonds.
The goal?
Lower interest rates, push liquidity into banks, and force economic growth.
It started with QE1, which led to QE2, then QE3, and eventually QE infinity—open-ended easing as needed.
When the pandemic hit, the Fed went into overdrive—printing $120 billion per month and exploding its balance sheet.
This wasn’t just an emergency measure.
It became the new normal.
This is also the main reason why we are dealing with inflation today.
Merging monetary policy (money printing) with fiscal policy (government spending) has created a battle between economic growth and inflation.
Originally, this level of spending was reserved for major recessions or financial crises (like 2008 or the 2020 COVID crash).
But now, it’s being used continuously as "modern" economic policy—even when there is no emergency.
The result?
Inflation everywhere.
Inflation isn't an accident. It's a direct result of reckless monetary policy.
One of the few people at the Federal Reserve who objected to this endless money printing was Thomas Hoenig, former president of the Kansas City Federal Reserve.
Hoenig had seen speculative bubbles before. He warned that Ben Bernanke’s policies (chronicled in The Lords of Easy Money) would widen the gap between the rich and poor.
And that’s exactly what happened.
The Real Consequence of the Everything Bubble
The biggest effect of this bubble wasn’t just inflation—it was extreme wealth inequality.
Inflation benefits asset owners (the rich) while crushing the working class.
The wealthy own stocks, real estate, and financial assets—all of which soared in value.
The middle and lower class?
They took on more debt—mortgages, auto loans, student loans—all while their wages struggled to keep up with inflation.
Every new dollar printed didn't go into the hands of average workers.
It flowed into financial markets, making the wealthy even wealthier.
Hoenig saw this coming years ago.
He argued that the Fed’s policies weren’t just dangerous—they were a slow-moving wealth transfer from the poor and middle class to asset owners.
But his warnings were ignored.
And now, here we are.
Bubble-Popping Catalysts
What will finally bring this bubble to an end?
Most likely an external shock to the system.
Whether it’s another round of Fed rate hikes, an oil price spike fueling inflation, or a geopolitical crisis escalating into war.
For now, Modern Monetary Theory (MMT) is on steroids, embraced by political parties in Washington, cheered on by Wall Street, and normalized by the financial media.
So, given the prevalence of bubbles in many asset categories, what should investors do?
The answer isn’t chasing overhyped trends.
It’s looking where no one else is. Finding what’s cheap, undervalued, overlooked, and underowned.
As I mentioned earlier, I don’t usually focus on macroeconomic trends like this. My real focus is on finding deep-value opportunities—stocks that the market is mispricing.
If you want to be notified when I cover a new undervalued stock, feel free to subscribe to Deep Value Insights.
Disclaimer: This content is for informational and educational purposes only and should not be considered investment advice. I’m just sharing my thoughts—not telling you what to do with your money. Some of what I write may turn out to be wrong. Always do your own research.
Excellent article that clearly explains how the shadowy financial system is a mechanism for transferring wealth from the less wealthy to the most wealthy.